The Question
“Who started the fire?” is important. But an equally important question is:
why can a small fire develop into such a massive landscape-scale wildfire?
Introduction: We Always Ask Who Started the Fire
Every time smoke covers the skies of Kalimantan, the question that almost always emerges is the same: who started the fire? That question is important, especially for law enforcement. But it is not enough. A focus that is too narrow on the person who lit the fire can cause us to fail to distinguish four things that are scientifically different: where the fire first started, the type of land where the fire emerged, where the fire subsequently spread, and the landscape conditions that allowed the fire to become large.
Therefore, the claim that forest and land fires in Kalimantan are primarily caused by community farming and land clearing should not be accepted or rejected solely on the basis of impressions, the number of suspects, or the proximity of hotspots to villages. Such a claim must be tested spatially and proportionally: how much land is managed by communities, how many fire events actually originate there, how often fires escape the boundaries of cultivated plots, and how does that risk compare with other types of land use?
Existing literature presents a far more complex picture. Fires in Kalimantan are the result of interactions among human ignition, deforestation and degradation, peatland drainage, fuel accumulation, land-use expansion, tenure conflicts, and extreme drought. Under certain conditions, communities do use fire to clear land. In other situations, fires are strongly associated with degraded landscapes and industrial plantations. In drained peatlands, El Niño can amplify fire events without having a simple relationship with the dominant livelihoods of villages.
Research by Page et al. (2002) demonstrates the scale of consequences when disturbed peatlands meet drought. In a study area of approximately 2.5 million hectares in Central Kalimantan during the 1997 fires, around 0.79 million hectares burned, of which approximately 0.73 million hectares were peatland. Their estimates indicate that peat and vegetation fires in Indonesia in 1997 released approximately 0.81–2.57 gigatons of carbon.
Four Concepts That Must Not Be Confused
| Concept | Question | What can be concluded? |
|---|---|---|
| Ignition / fire starting point | Where did a fire event begin? | Most relevant for discussing the source of ignition. |
| Hotspot / heat detection | Where did a sensor detect a thermal anomaly? | Does not automatically indicate the starting point or the entire burned area. |
| Burned area / burn scar | Which land ultimately burned? | Measures spatial impact, not automatically the person responsible for ignition. |
| Land ownership/use | Who or what activity is associated with the location? | Helps with attribution, but concession/village boundaries are not direct evidence of who started the fire. |
This distinction is important because a fire may ignite in one land-use class and then spread into another. Therefore, the area of forest or peatland that burns is not necessarily the same as the area where the initial ignition occurred.
Before Kalimantan Became a Fire Problem
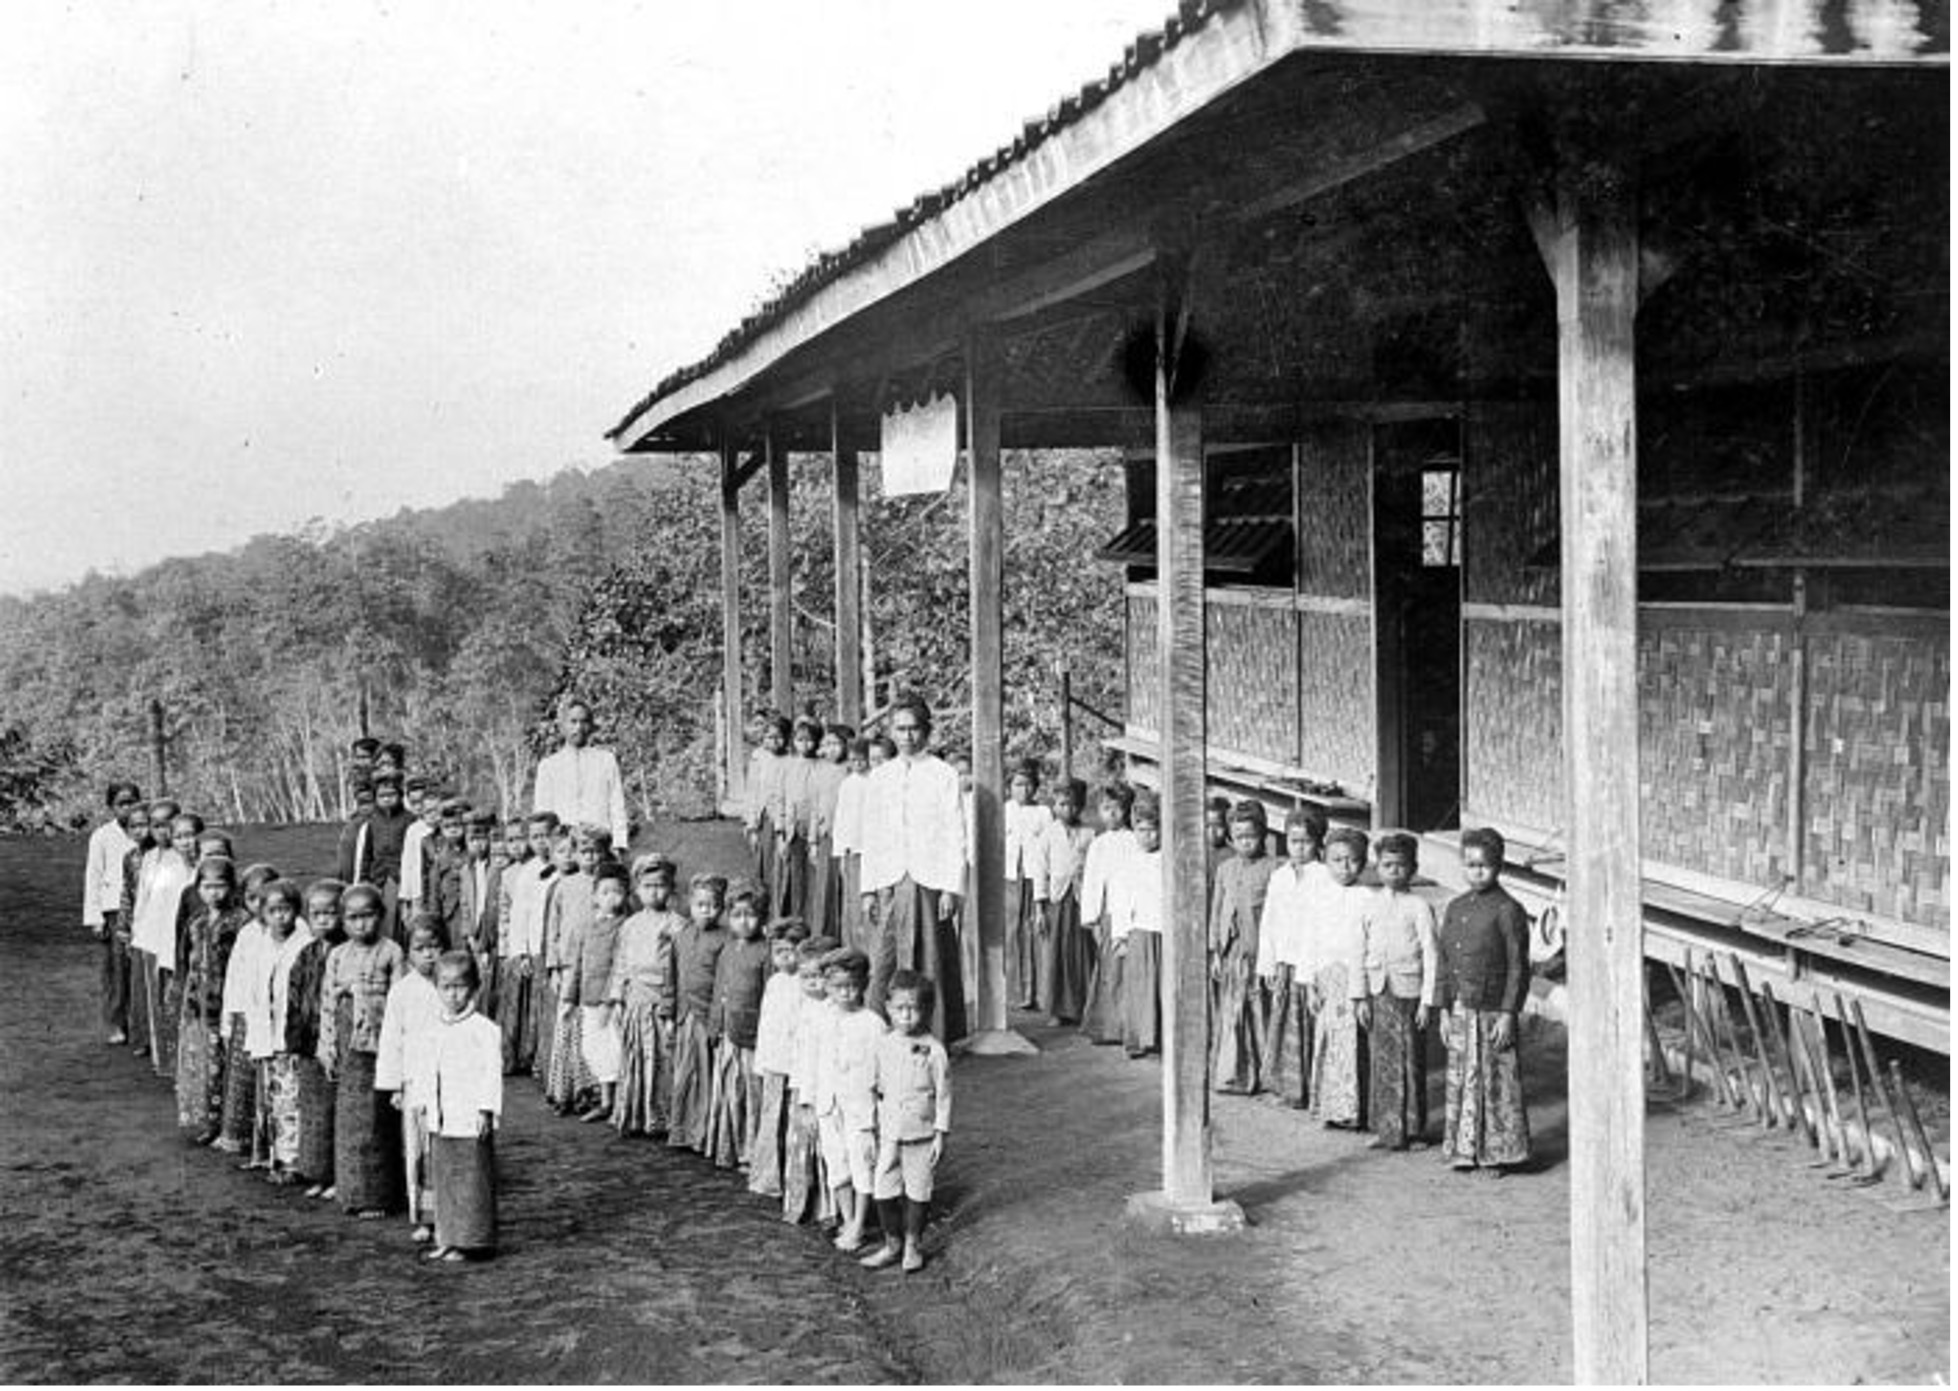
Fire is not something new to the people of Kalimantan. Various Indigenous communities and shifting cultivators have long used fire in rotational or swidden farming systems. In traditional practices, burning is not simply a matter of setting vegetation alight. It is connected to knowledge of seasons, fuel moisture, wind direction, burning boundaries, firebreaks, labor, supervision, and social rules.
Therefore, equating all fire use with large-scale wildfire is an analytical error. Traditional swidden systems operate within particular socio-ecological contexts: relatively limited areas, fallow periods, mosaics of vegetation of different ages, and community-based monitoring mechanisms. But romanticizing these practices is also inappropriate. Not all traditional burning is safe, and changes in population density, fallow periods, commodity markets, and landscape fragmentation can alter their risk profile.
The more useful question is not “Do communities use fire?” because the answer is clear: some communities do. The scientific question is: “How large is the contribution of such fire use to the number of ignitions and the extent of large fires compared with other sources and landscape conditions?”
When Forests Are No Longer Simply Forests
Major changes occurred as Kalimantan’s forests and lands became increasingly integrated into extractive economies and large-scale commodity production. Logging, road construction, forest conversion, plantations, agriculture, and development projects have altered the structure of the landscape and the distribution of fuel.
Gaveau et al. (2014), using long-term satellite-image reconstruction across Borneo, estimated that approximately 30.7 percent of Kalimantan’s 1973 forest had become non-forest by 2010. The study also demonstrated the extensive footprint of logging and industrial plantation expansion since the 1970s. This figure does not prove that industry “caused every fire,” but it shows that the ecological context in which fires operate has changed profoundly.
In relatively intact humid forests, vegetation moisture and microclimate constrain fire spread. Once the canopy is opened, forest edges increase, understory vegetation dries, and human access expands, the likelihood of ignition and the ability of fire to spread can change. In peatlands, the transformation is far more extreme when drainage lowers the water table and turns wet organic matter into combustible fuel that can burn below the surface.
Mega Rice Project: When Peatlands Were Forced to Become Rice Fields
One of the most important lessons comes from the Mega Rice Project in Central Kalimantan in the mid-1990s. The project was designed to convert approximately one million hectares of land, including extensive peatland landscapes, into agricultural production areas. Thousands of kilometers of canals were constructed to regulate and drain water.
The problem was not simply that an agricultural project failed. Drainage altered the hydrological system. When El Niño brought severe drought in 1997–1998, peatlands that had already lost their natural wet conditions became an enormous source of fuel. Fire did not merely burn surface vegetation; it could enter the peat layer, persist for long periods, produce dense smoke, and become extremely difficult to extinguish.
The lesson is simple but fundamental: drought can be a trigger, but landscape conditions determine whether that trigger produces a small fire or a major disaster. Therefore, the history of drainage, forest clearing, and degradation must be treated as part of the explanation for fires, rather than merely as background context.
What Do the Data Say About Where Fires Start?
The study by Cattau et al. (2016) is important because it explicitly attempted to distinguish fire detection from ignition events across the peatland landscape of Central Kalimantan during 2000–2010. They examined the frequently made claim that fires primarily originated from oil palm concessions or from small-scale agriculture near settlements.
The results did not support a single explanation. Approximately 68–71 percent of fire events within the study area originated in non-forest classes, around 17–19 percent in oil palm concessions, and only about 6–9 percent were located within a 5 km radius of settlements. Most fires that originated inside oil palm concessions or near settlements remained within those areas; only a small proportion were identified as spreading outward and becoming sources of fire in other classes.
However, these findings also do not mean that settlements or plantations are irrelevant. Ignition density within oil palm concessions was nearly the same as in non-forest areas, while the highest density was found near settlements. This means that absolute numbers, event density, and spread must be considered together.
Most importantly for our debate, the “non-forest” class in that study was heterogeneous. It included scrubland, ferns, open peatlands, young plantations, agricultural land, and degraded forest. Therefore, concluding that “most fires originated in non-forest areas, therefore most originated from community farms” is a categorical leap that cannot be justified.
The study has an important limitation: its study area was a particular peatland landscape in Central Kalimantan, not the entire island of Kalimantan. Precisely because of this, it should be used as evidence that fire attribution requires spatial precision, rather than as a single figure generalized to every province.
“Non-forest” is a land-cover/land-use class. “Community farming” is a socio-economic management category. The two are not identical.
When All of Kalimantan Is Viewed Together
The analysis by Santika et al. (2020) broadens the perspective by examining fire patterns across Kalimantan as a whole during 2002–2017, using information on climate, soil type, forest degradation status, village livelihoods, and the presence of concessions.
They found different patterns according to landscape type. In relatively intact forests, fire density in villages with substantial overlap with oil palm concessions was approximately twice as high as in villages outside concessions. On degraded land over mineral soils, fires were most frequently found in villages containing industrial plantations. Meanwhile, in degraded peatlands, fires increased sharply during El Niño years regardless of the dominant livelihood of the village.
This finding is particularly important because it demonstrates that no single variable can explain fires throughout Kalimantan. In one place, industrial land use may be more prominent; elsewhere, peatland conditions and drought may become the dominant risk multipliers. Policies that treat all fires as one phenomenon and all fire starters as one category will fail to capture this variation.
A Small Fire Does Not Always Become a Large Wildfire
The source of a fire and the conditions that allow it to become a disaster are two different things.
A match, the burning of crop residues, a cigarette butt, hunting activities, land conflicts, or land clearing can become an ignition source. But whether that ignition dies out or develops into a landscape-scale fire depends on moisture, fuel, wind, topography, firefighting access, and, particularly in certain areas, peatland conditions.
Imagine two ignitions of the same initial size. The first occurs on a moist mineral-soil plot that is monitored and surrounded by firebreaks. The second occurs near dry scrub connected to drained peatland at the peak of the dry season. Legally, both may simply be “fires,” but ecologically their potential impacts are vastly different.
Therefore, policies that pursue ignition alone without restoring landscape vulnerability will always be working downstream. Law enforcement remains necessary, but it must operate alongside drainage control, peatland restoration, fuel reduction, spatial planning, conflict prevention, and alternatives to burning for land preparation.
Then Came Oil Palm: Commodities, Land Value, and Incentives
Oil palm should not be treated as the sole cause of fires. But neither can its expansion be excluded from the analysis. High-value commodities change incentives surrounding land: land that was previously considered of low value can become a productive asset, an object of speculation, or an arena for conflict.
Falcon et al. (2022), through research involving 275 villages in four fire-prone districts in West Kalimantan, emphasized that land burning must be understood within real incentive structures. Their study did not find that conditional cash incentives for villages simply eliminated fires; climate variation, policy, population density, accidents, and the high value of land for oil palm also shaped the outcomes.
This finding instead reminds us not to replace one scapegoat with another. “Companies,” “communities,” and “oil palm” are each insufficient as causal categories. What needs to be traced is who controls the land, for what purpose the land is cleared, who conducts the burning, who benefits from land-use change, and who has the capacity to prevent fires from spreading.
Community Farming: Testing the Hypothesis with Data, Not Assumptions
If the hypothesis is that “forest and land fires in Kalimantan are primarily caused by community land clearing,” testing it requires more than demonstrating that communities use fire. We need to know whether fires on community farms occur disproportionately relative to the amount of farming land available.
For example, if community farms account for only 10 percent of the area of a district but 45 percent of identified ignitions originate on farmland, there is strong indication that the risk is disproportionate. Conversely, if farmland accounts for 20 percent of the territory but only 5 percent of ignitions originate there, the claim that farmland is the primary source becomes weaker.
A simple indicator is the ignition rate or burned area per unit area of a land type. In other words, the denominator is just as important as the numerator. One thousand hectares burned in a particular category does not mean the same thing if that category covers 5,000 hectares compared with 500,000 hectares.
Fire incidence rate = burned area within a land type ÷ total area of that land type × 100
An even stronger approach is ignition density: the number of fire events estimated to have originated within a particular land-use type divided by the area of that land-use type. This analysis can then control for peatland, rainfall, El Niño, degradation, distance to roads, and the presence of concessions.
2019 Data Test: Does the Fire Pattern Follow the Extent of Swidden/Fallow Fields?
To put this hypothesis directly against the numbers, we can use 2019 as an initial stress test. The Center for Agricultural Data and Information Systems recorded the area of swidden/fallow fields (ladang/huma) in 2019 based on BPS data, while BNPB recorded the area of forest and land burned during the same year. This comparison does not yet establish who started the fires, but it can test a more fundamental claim: does the scale of burning move in line with the extent of swidden/fallow fields?
The results do not show a simple pattern. Total ladang/huma across the five Kalimantan provinces reached approximately 677,757 hectares, while the burned area reached approximately 684,599 hectares. More important than the total figures is their distribution across provinces.
Table 1. Area of Swidden/Fallow Fields and Burned Area in Five Kalimantan Provinces, 2019
| Province | Swidden/Fallow Fields (ha) | Burned Area (ha) | Burned Area ÷ Swidden | Interpretation |
|---|---|---|---|---|
| West Kalimantan | 259,026 | 151,919 | 58.7% | Burned area is smaller than the stock of swidden/fallow fields. |
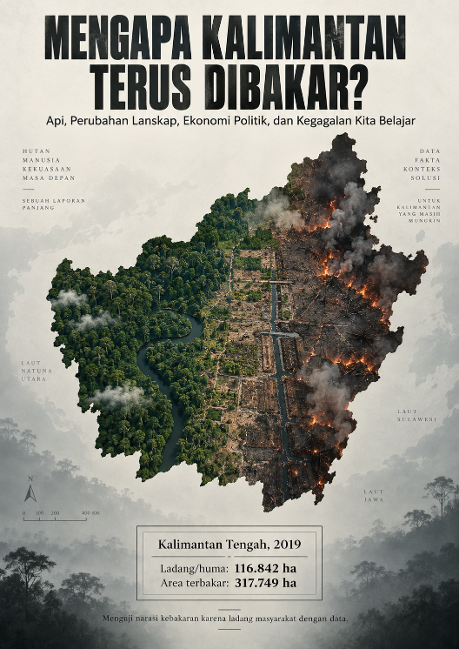
| Central Kalimantan | 116,842 | 317,749 | 271.9% | Burned area is more than 2.7 times the stock of swidden/fallow fields. |
| South Kalimantan | 97,937 | 137,848 | 140.8% | Burned area exceeds the entire stock of swidden/fallow fields. |
| East Kalimantan | 188,904 | 68,524 | 36.3% | Burned area is smaller than the stock of swidden/fallow fields. |
| North Kalimantan | 15,048 | 8,559 | 56.9% | Burned area is smaller than the stock of swidden/fallow fields. |
| TOTAL | 677,757 | 684,599 | 101.0% | In aggregate, burned area is almost equal to the entire stock of swidden/fallow fields. |
Source: Statistik Lahan Pertanian 2015–2019, Pusdatin Pertanian/BPS; Data Bencana Indonesia 2019, BNPB. The 2019 ladang/huma figures in the Pusdatin publication were provisional.
Central Kalimantan is the most striking case. The recorded area of ladang/huma was approximately 116,842 hectares, while the burned area reached 317,749 hectares. In other words, the burned area was equivalent to approximately 271.9 percent of the province’s entire stock of ladang/huma. South Kalimantan showed a similar pattern: 97,937 hectares of ladang/huma compared with 137,848 hectares burned, or approximately 140.8 percent.
These figures do not prove that no fires originated from farmland. A single ignition on a farm can spread into scrubland, degraded forest, or peatland, causing the final burned area to become much larger than the original plot. But the figures do refute an interpretation that equates “burned area” with “the area of farmland burned by communities.” In Central Kalimantan alone, even if all ladang/huma burned once, an extreme assumption, there would still be approximately 200,907 hectares of burned area beyond the total stock of ladang/huma that would need to be explained.
The interprovincial pattern also does not support a simple mechanical relationship. West Kalimantan accounts for approximately 38.2 percent of the total ladang/huma across the five provinces, but only around 22.2 percent of total burned area. East Kalimantan has approximately 27.9 percent of ladang/huma, but only around 10.0 percent of burned area. Conversely, Central Kalimantan has only around 17.2 percent of ladang/huma, but accounts for approximately 46.4 percent of burned area.
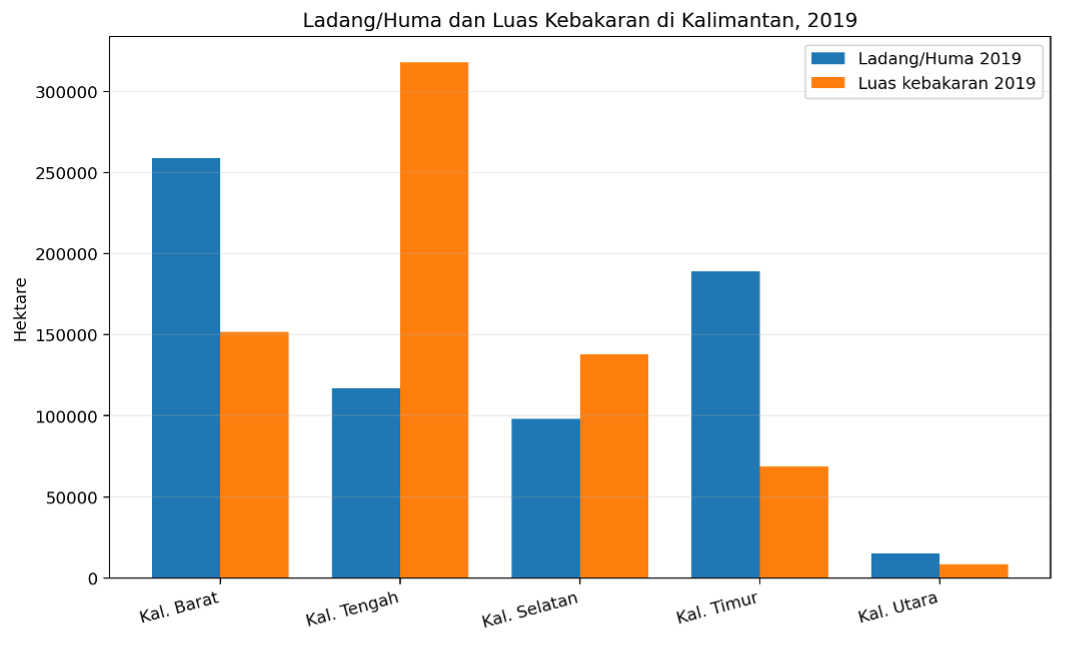
Figure 1 caption:
“The size of swidden/fallow fields does not move in the same direction as the size of burned area. Central Kalimantan has a smaller stock of swidden/fallow fields than West Kalimantan and East Kalimantan, yet its burned area is far larger.”
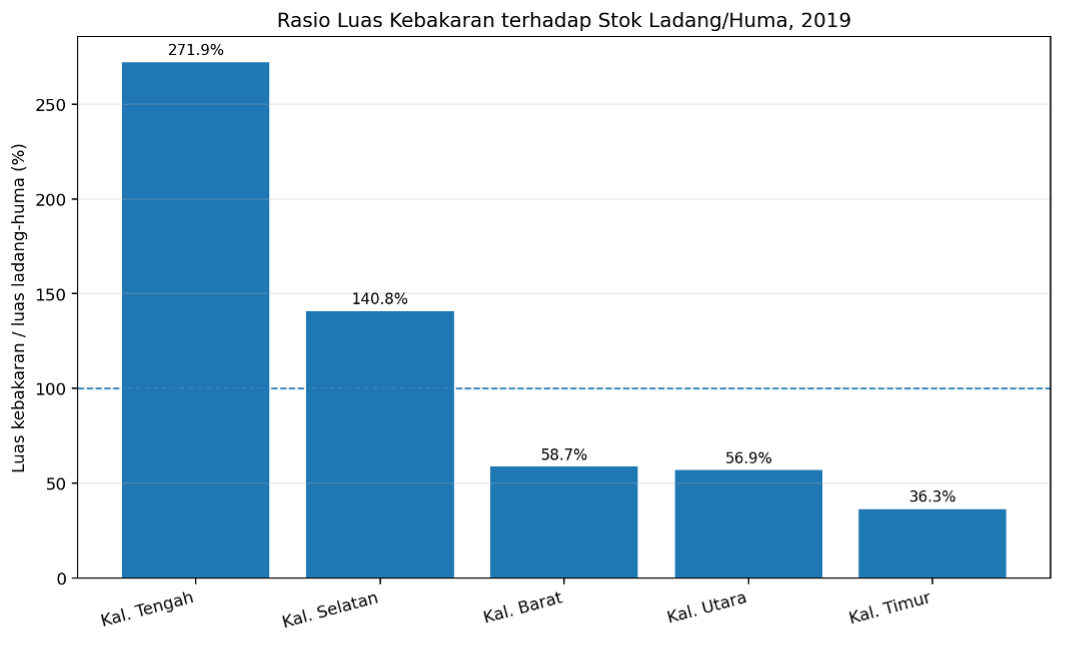
Figure 2 caption:
“The ratio of burned area to swidden/fallow area exceeds 100 percent in Central Kalimantan and South Kalimantan. The 100 percent line is not a causal threshold, but an indicator that burned area exceeds the entire stock of swidden/fallow fields.”
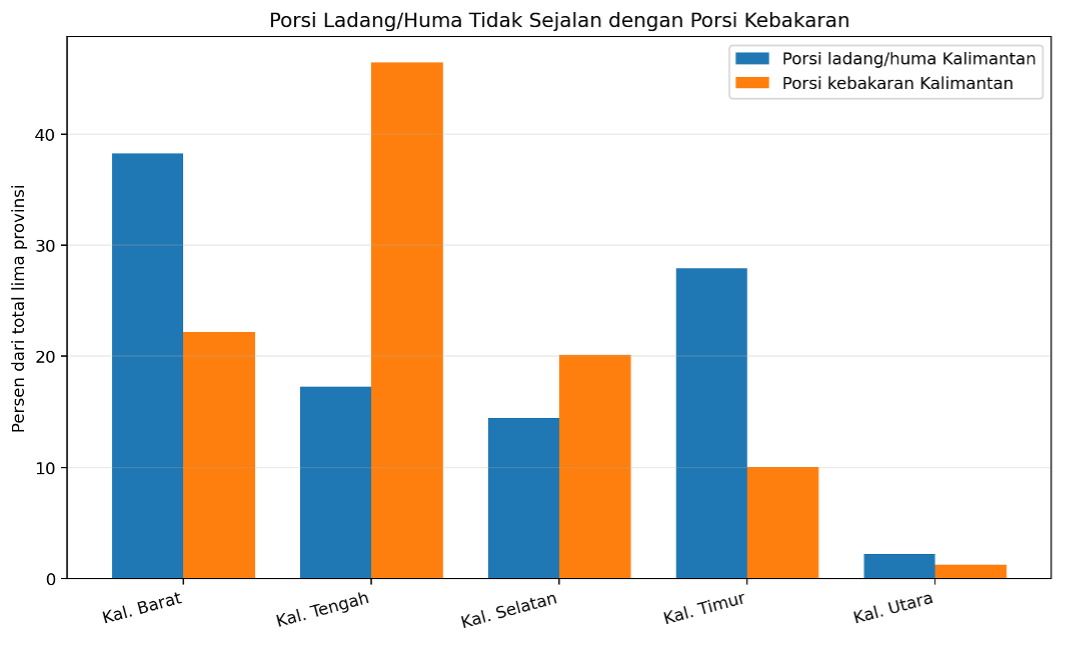
Figure 3 caption:
“The share of swidden/fallow fields and the share of burned area do not correspond. The largest mismatch can be seen in Central Kalimantan.”
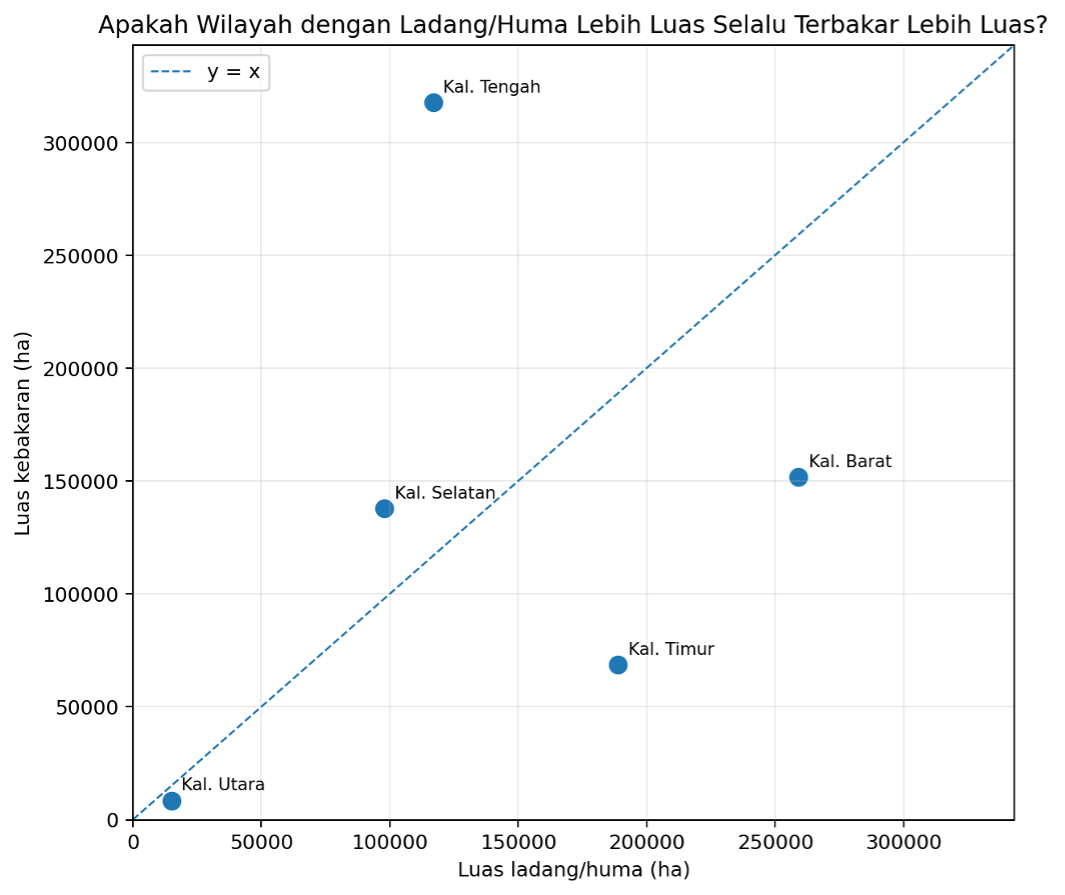
Figure 4 caption:
“The scatter plot shows no simple pattern in which provinces with larger areas of swidden/fallow fields automatically experience larger burned areas. With only five provinces, the graph is a visual diagnosis, not a statistical causal test.”
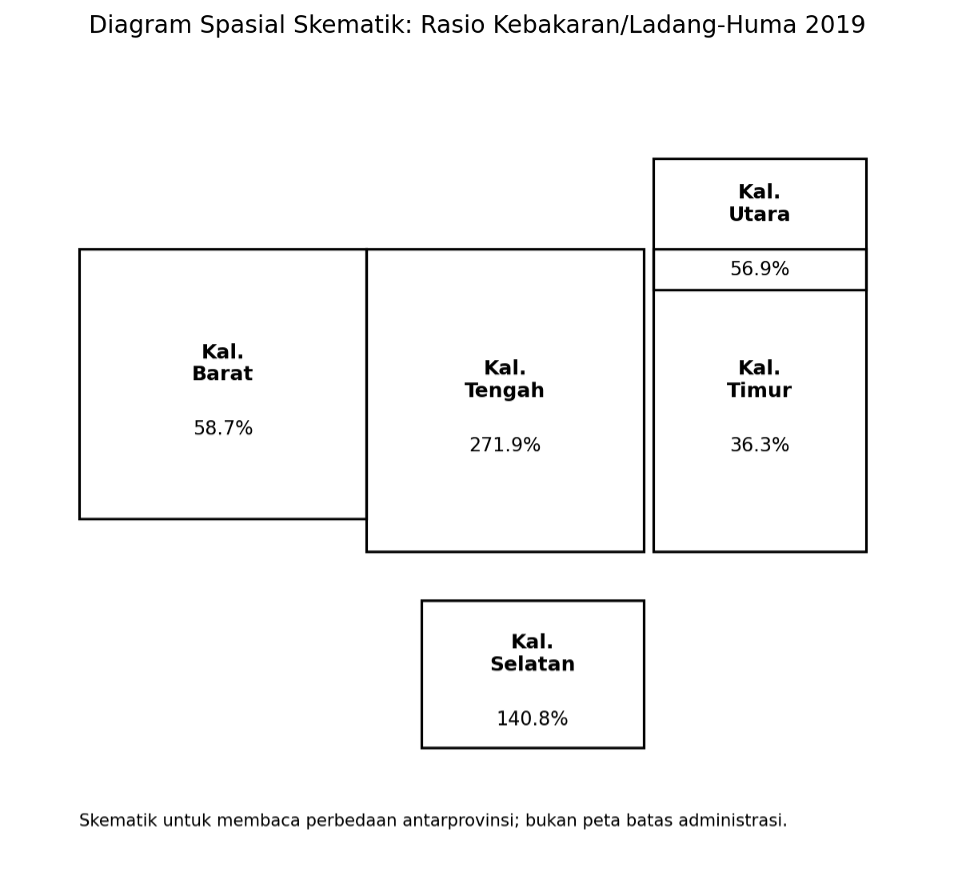
Figure 5 caption:
“Schematic spatial diagram of the ratio of burned area to swidden/fallow area. This diagram only helps illustrate contrasts among provinces and is not a geographic map or evidence of ignition locations.”
Contributors:
Fadhli addifa firdaus